
Paying more for the same growth
€60 → €90
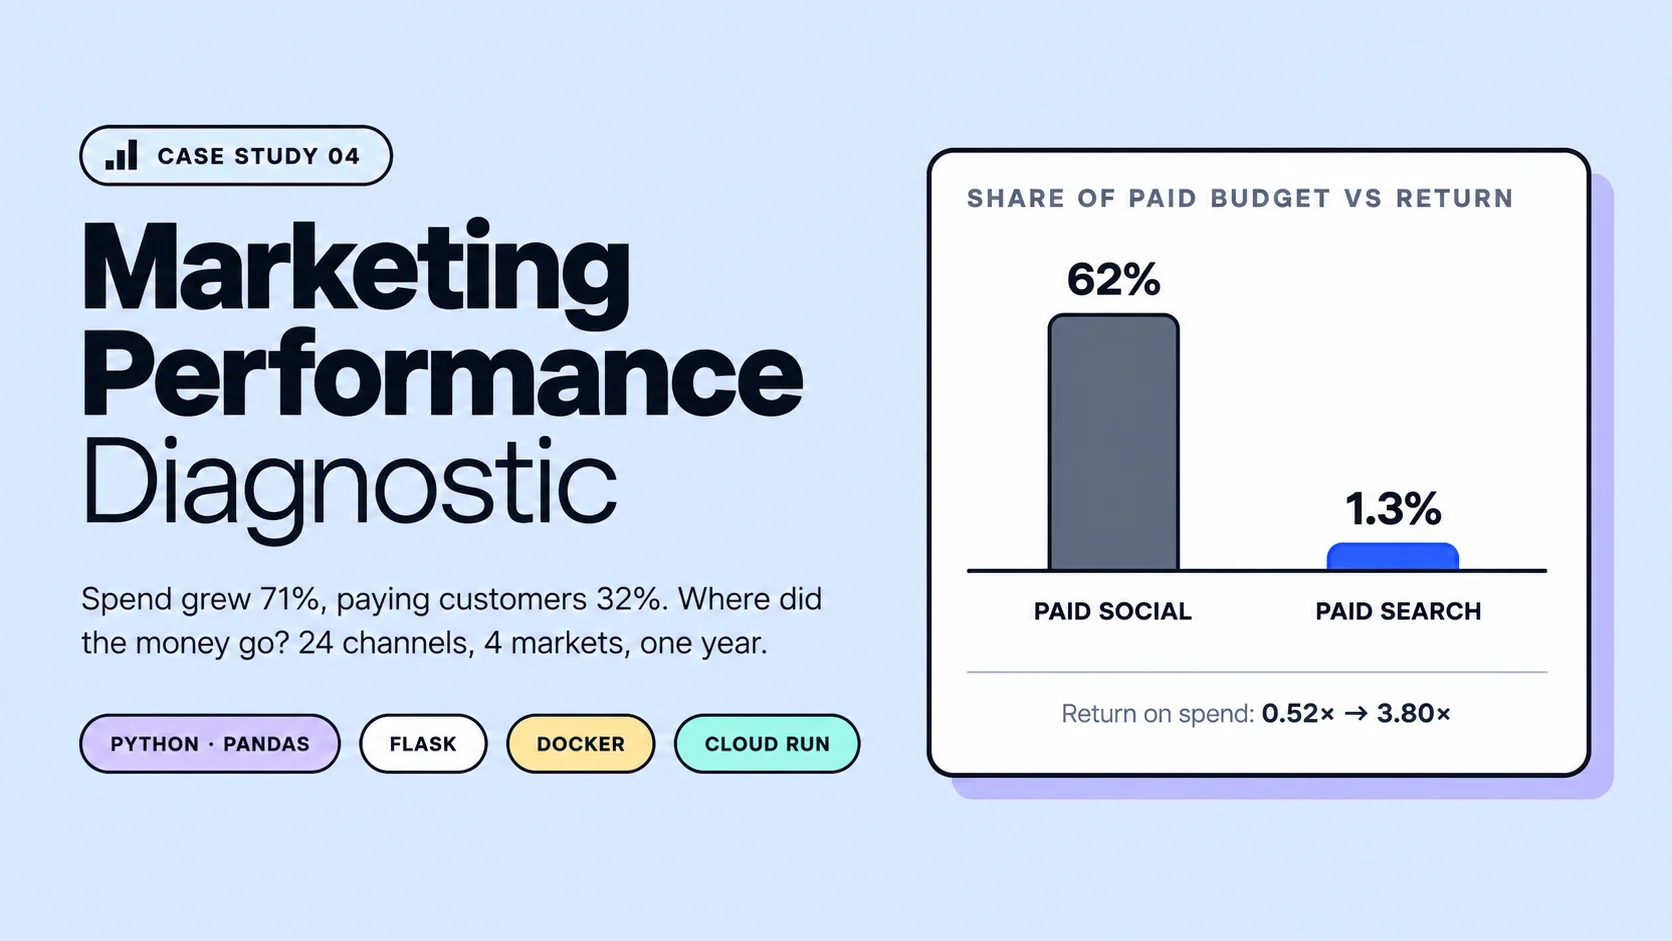
The dominant paid channel took 62% of budget at €68.97 per paying customer and 0.52× return. Its spend grew 132% across the year while its cost per customer rose 50%.
A marketing performance diagnostic on a full year of anonymized campaign data from a Berlin-based subscription business, written for a CEO audience. It answers five questions, from "how are we doing?" to "where should the next euro go?", and ships as a tested, reproducible web app.
€5.95M
marketing spend analysed across 4 markets and 24 channels, one full year
1.03×
blended return on ad spend, on confirmed payments only
62% at 0.52×
of paid budget went to one channel returning half of what it cost
€1.3M
proposed reallocation at the same total budget, with a 90-day plan
About the numbers
The company's name and identifying details are withheld. Every figure under "What happened" is computed from the dataset: 1,152 rows of channel-by-month data for 2024. The reallocation results are modeled estimates under stated assumptions, not observed outcomes.
My role: solo, covering the analysis, the metric definitions, the data validation, the web app and the deployment pipeline.
The brief
What happened
Indexed from January to December, spend grew 39 points faster than paid conversions. By the fourth quarter, cost per paying customer was 23% higher than in the first, and the channel mix hid it.
€60 → €90
The dominant paid channel took 62% of budget at €68.97 per paying customer and 0.52× return. Its spend grew 132% across the year while its cost per customer rose 50%.
3.80× on 1.3%
Paid search returned 3.80× at €9.71 per paying customer on 1.3% of spend. Influencer partnerships converted 29% of trials to paid, the highest of any paid channel.
26% vs 17.6%
The core market converted 26% of trials to paid at 1.17× return. The weakest converted 17.6%: a funnel problem, not a media problem, so more spend there would not fix it.
Markets
Only one market paid back its spend. Trial-to-paid conversion separated a market that needs better media from one that needs a better checkout.
| Market | Cost per paying customer | Return on spend | Trial to paid | Verdict |
|---|---|---|---|---|
| Core | €33.41 | 1.17× | 26.0% | Flagship |
| Secondary | €48.04 | 0.85× | 27.5% | Optimize media |
| Emerging | €43.37 | 0.87× | 17.6% | Fix funnel first |
The recommendation
Same total budget, moved from the saturated channel and two weak ones to the channels with the best cost and conversion quality, plus a small test budget. These are modeled estimates, not results.
| Channel | Current | Proposed | Change | Paid customers (modeled) |
|---|---|---|---|---|
| Paid social (dominant) | €3.71M | €2.40M | −€1.31M | −19,000 |
| Influencer partnerships | €1.70M | €2.40M | +€701k | +18,750 |
| Paid search | €75k | €600k | +€525k | +54,070 |
| Podcast partnerships | €3k | €250k | +€247k | +25,000 to 49,000 |
| Underperforming social | €447k | €0 | −€447k | −6,400 |
| Test budget (new) | · | €298k | +€298k | +7,500 |
+30k to 55k
net paid customers, the conservative range
+€1.2M to 2.2M
implied revenue lift
€38 → ~€28
blended cost per paying customer
The rows assume each channel keeps its current cost per customer as it grows, with influencer spend capped at +60% for diminishing returns. The headline range is well below the sum of the rows, because small channels rarely keep their efficiency at ten or eighty times the spend.
90-day plan
Definitions
Most marketing debates are definition debates in disguise. Each choice below is written down, tested, and shown in the app next to the numbers it produces.
spend ÷ (monthly + yearly paid conversions)
Counted after the trial, not at sign-up. A channel that buys trials that never pay looks cheap on sign-ups and expensive here.
invoiced revenue ÷ spend
On confirmed payments, by invoice date. Revenue by sign-up date would count trial starters who never pay and overstate the return.
yearly paid ÷ yearly conversions
The quality signal cost alone can't show. It is what separated the influencer channel, and the weak market, from the rest.
How it is built
One the checks caught
One row reported a coupon share of 1.33, which is impossible for a share. The build flags it for the data team and caps it at 1.0 for the analysis, so it is visible instead of silently skewing the coupon numbers.
The live dashboard
Interactive charts, every channel's verdict, the market cards and the metric definitions. Scroll inside the frame, or open it in its own tab for the full view.
What the data can't show
A recommendation is only as strong as the data under it. These gaps set how far the numbers above can be trusted, and what to collect next.
The company is anonymized throughout. All processing runs inside a Docker container at build time; no raw data is reachable through the web app. The code is on GitHub; the dataset is not.
A three-part benchmark on putting AI on top of a semantic layer: BigQuery and Cube, dbt and MetricFlow, and Power BI.